
City Meter
City Meter is an app designed to measure noise pollution in cities thanks to online accessible webcams, and then represents it visually using datamoshing techniques.
The project was carried out during an experimental project course during my 3rd year of Visual Communication at HEAD-Genève.
Roles
UI+UX Design
Datamoshing
Timeframe
2 months—Nov to Dec 2022
Teachers
Martine Anderfuhren
Anette Lenz
Alban Thomas
Why Noise Pollution?
Being quite a sensitive person to noise, I wanted to design an app that could raise awareness about the dangers of noise pollution in cities around the world.
Some Background
After conducting research, I discovered that Geneva (the city I’m studying in) was the noisiest city in Switzerland, knowing that Zürich for example is in the average.
The goal of my project is to break this almost idyllic landscape that we have when we think about cities and with all the advantages they can have.
We almost never think about the noise, or at least I've never seen people on Instagram post pictures where they complain about the noise in the city.
How does it work?
The noise disturbs the incoming city webcams video feed and makes it glitchy. A metaphor of how the brain interprets noise and it becomes an interpretation of sensory overload.
Underneath is an example with a video. The sound’s binary data is pasted into the video’s binary data. No After Effects or software required. This is real glitch, and it’s called datamoshing.
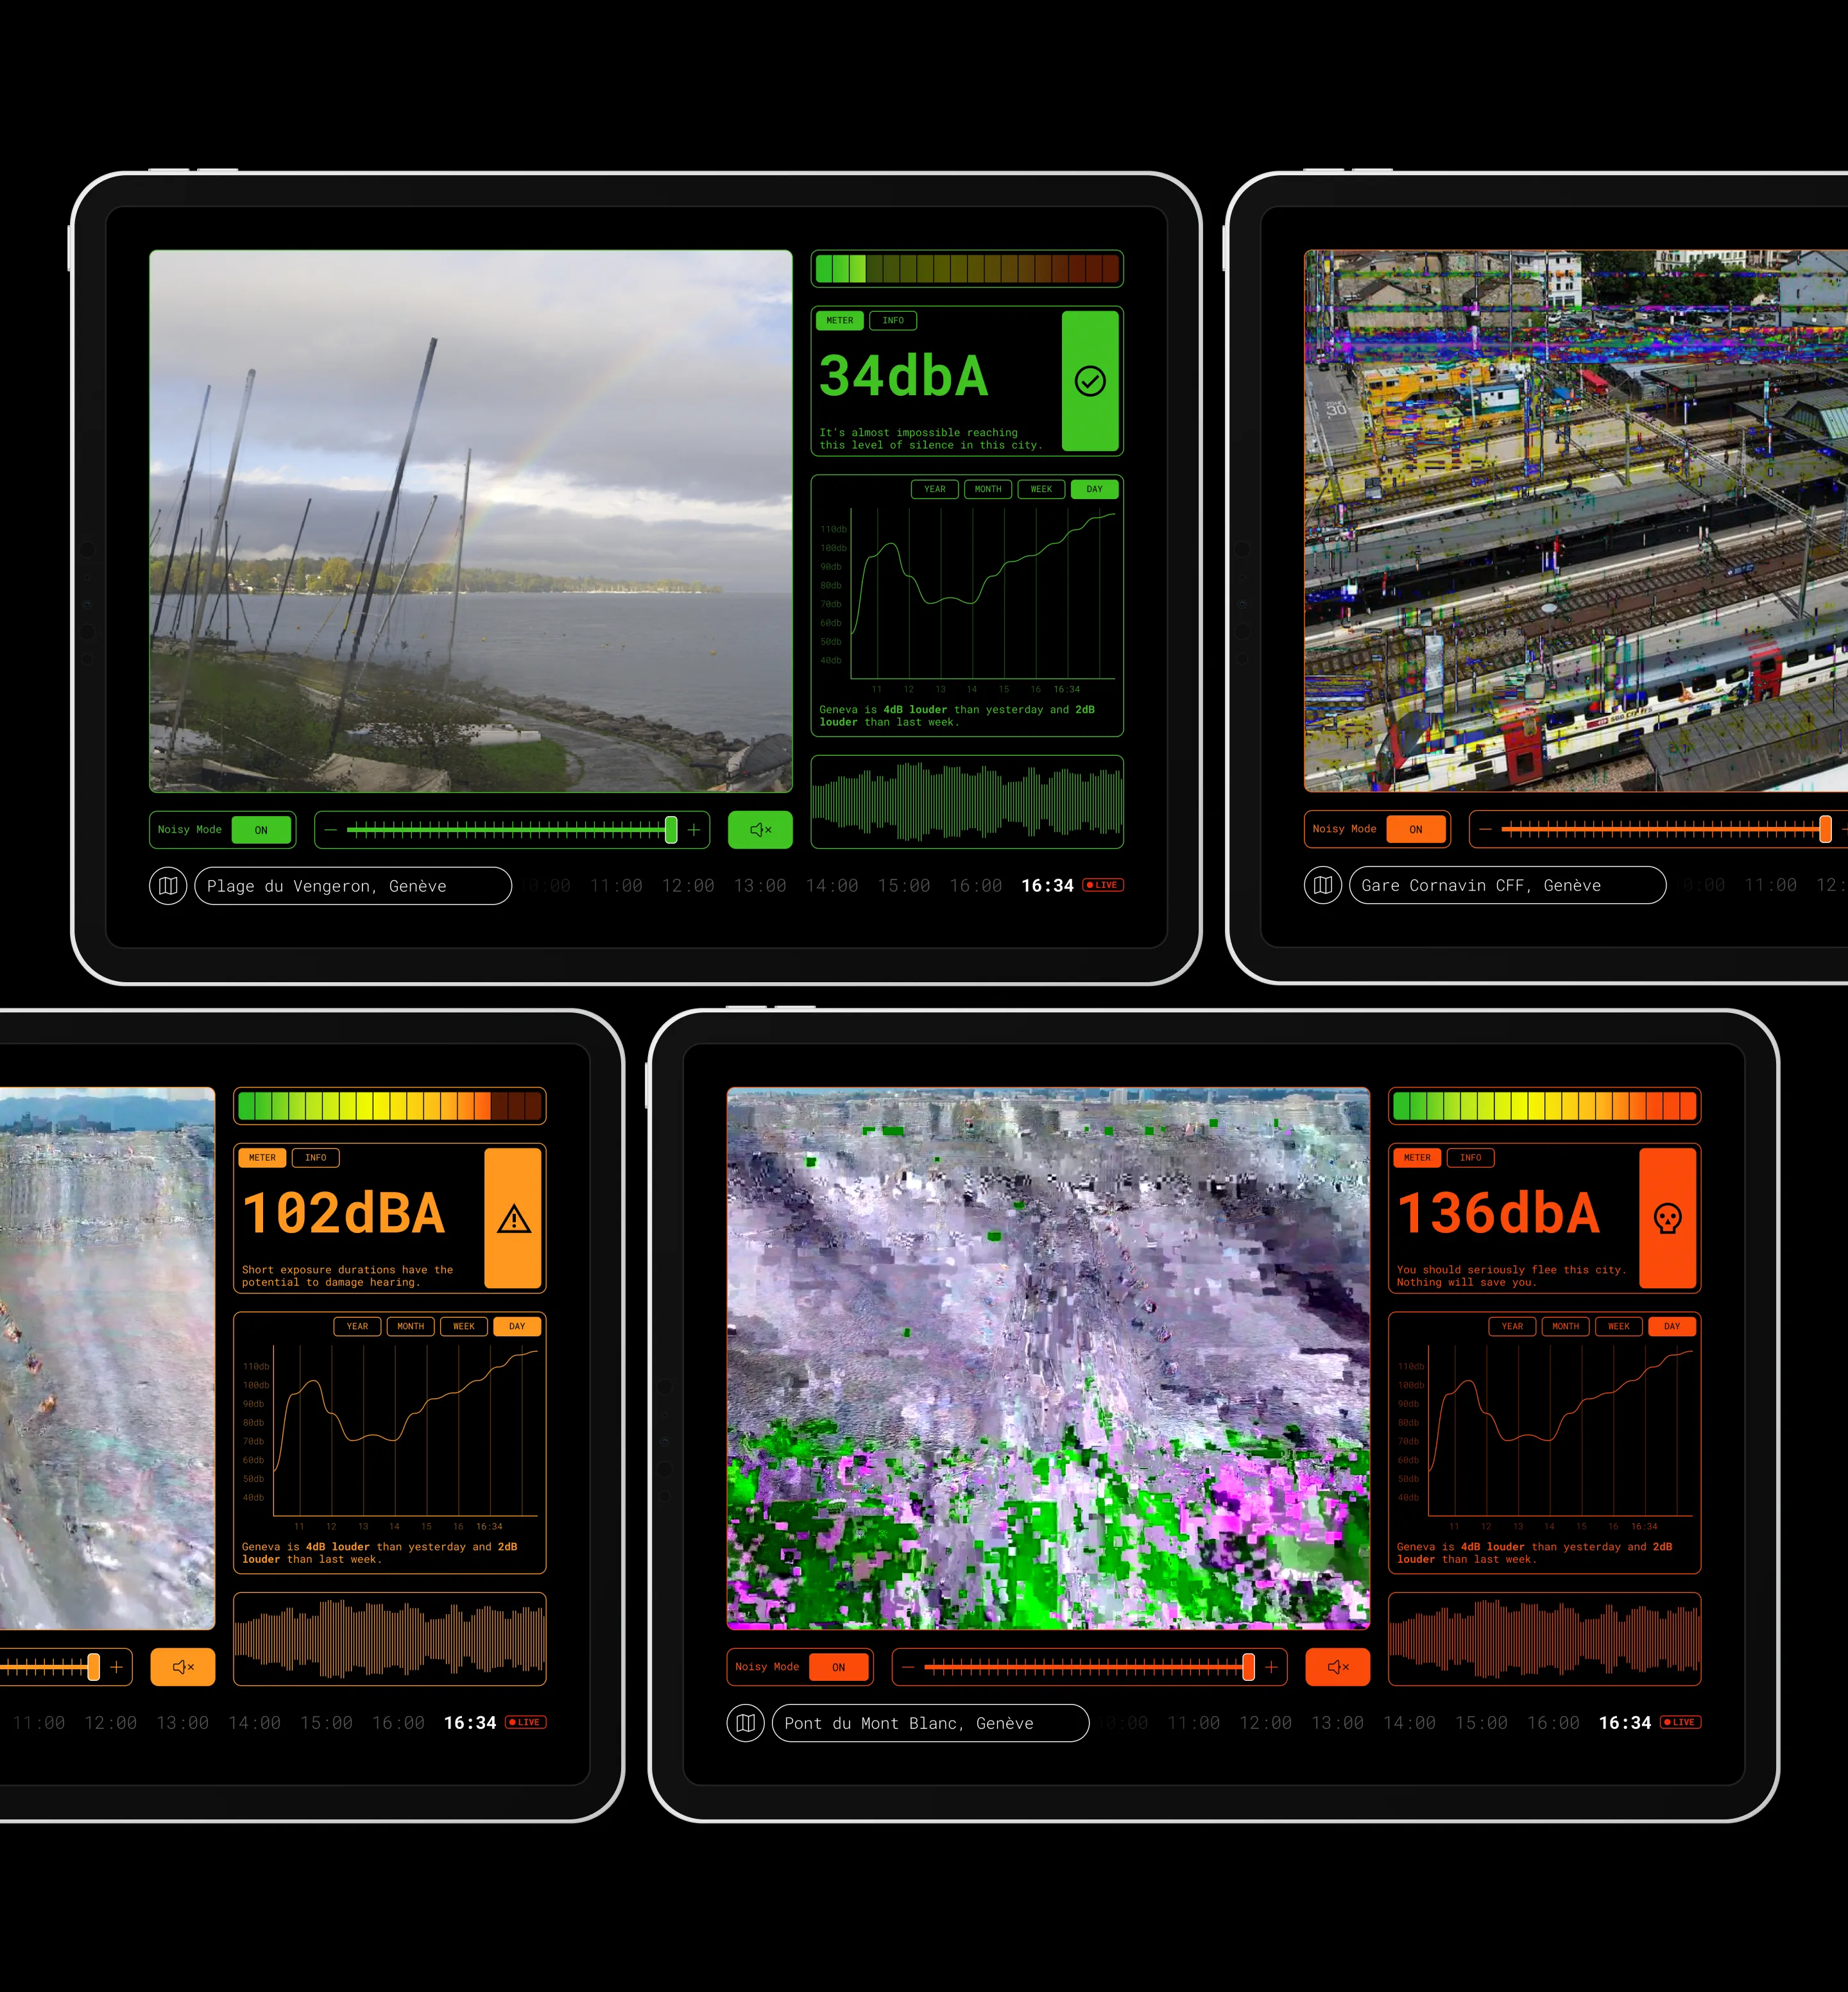
And here's the app
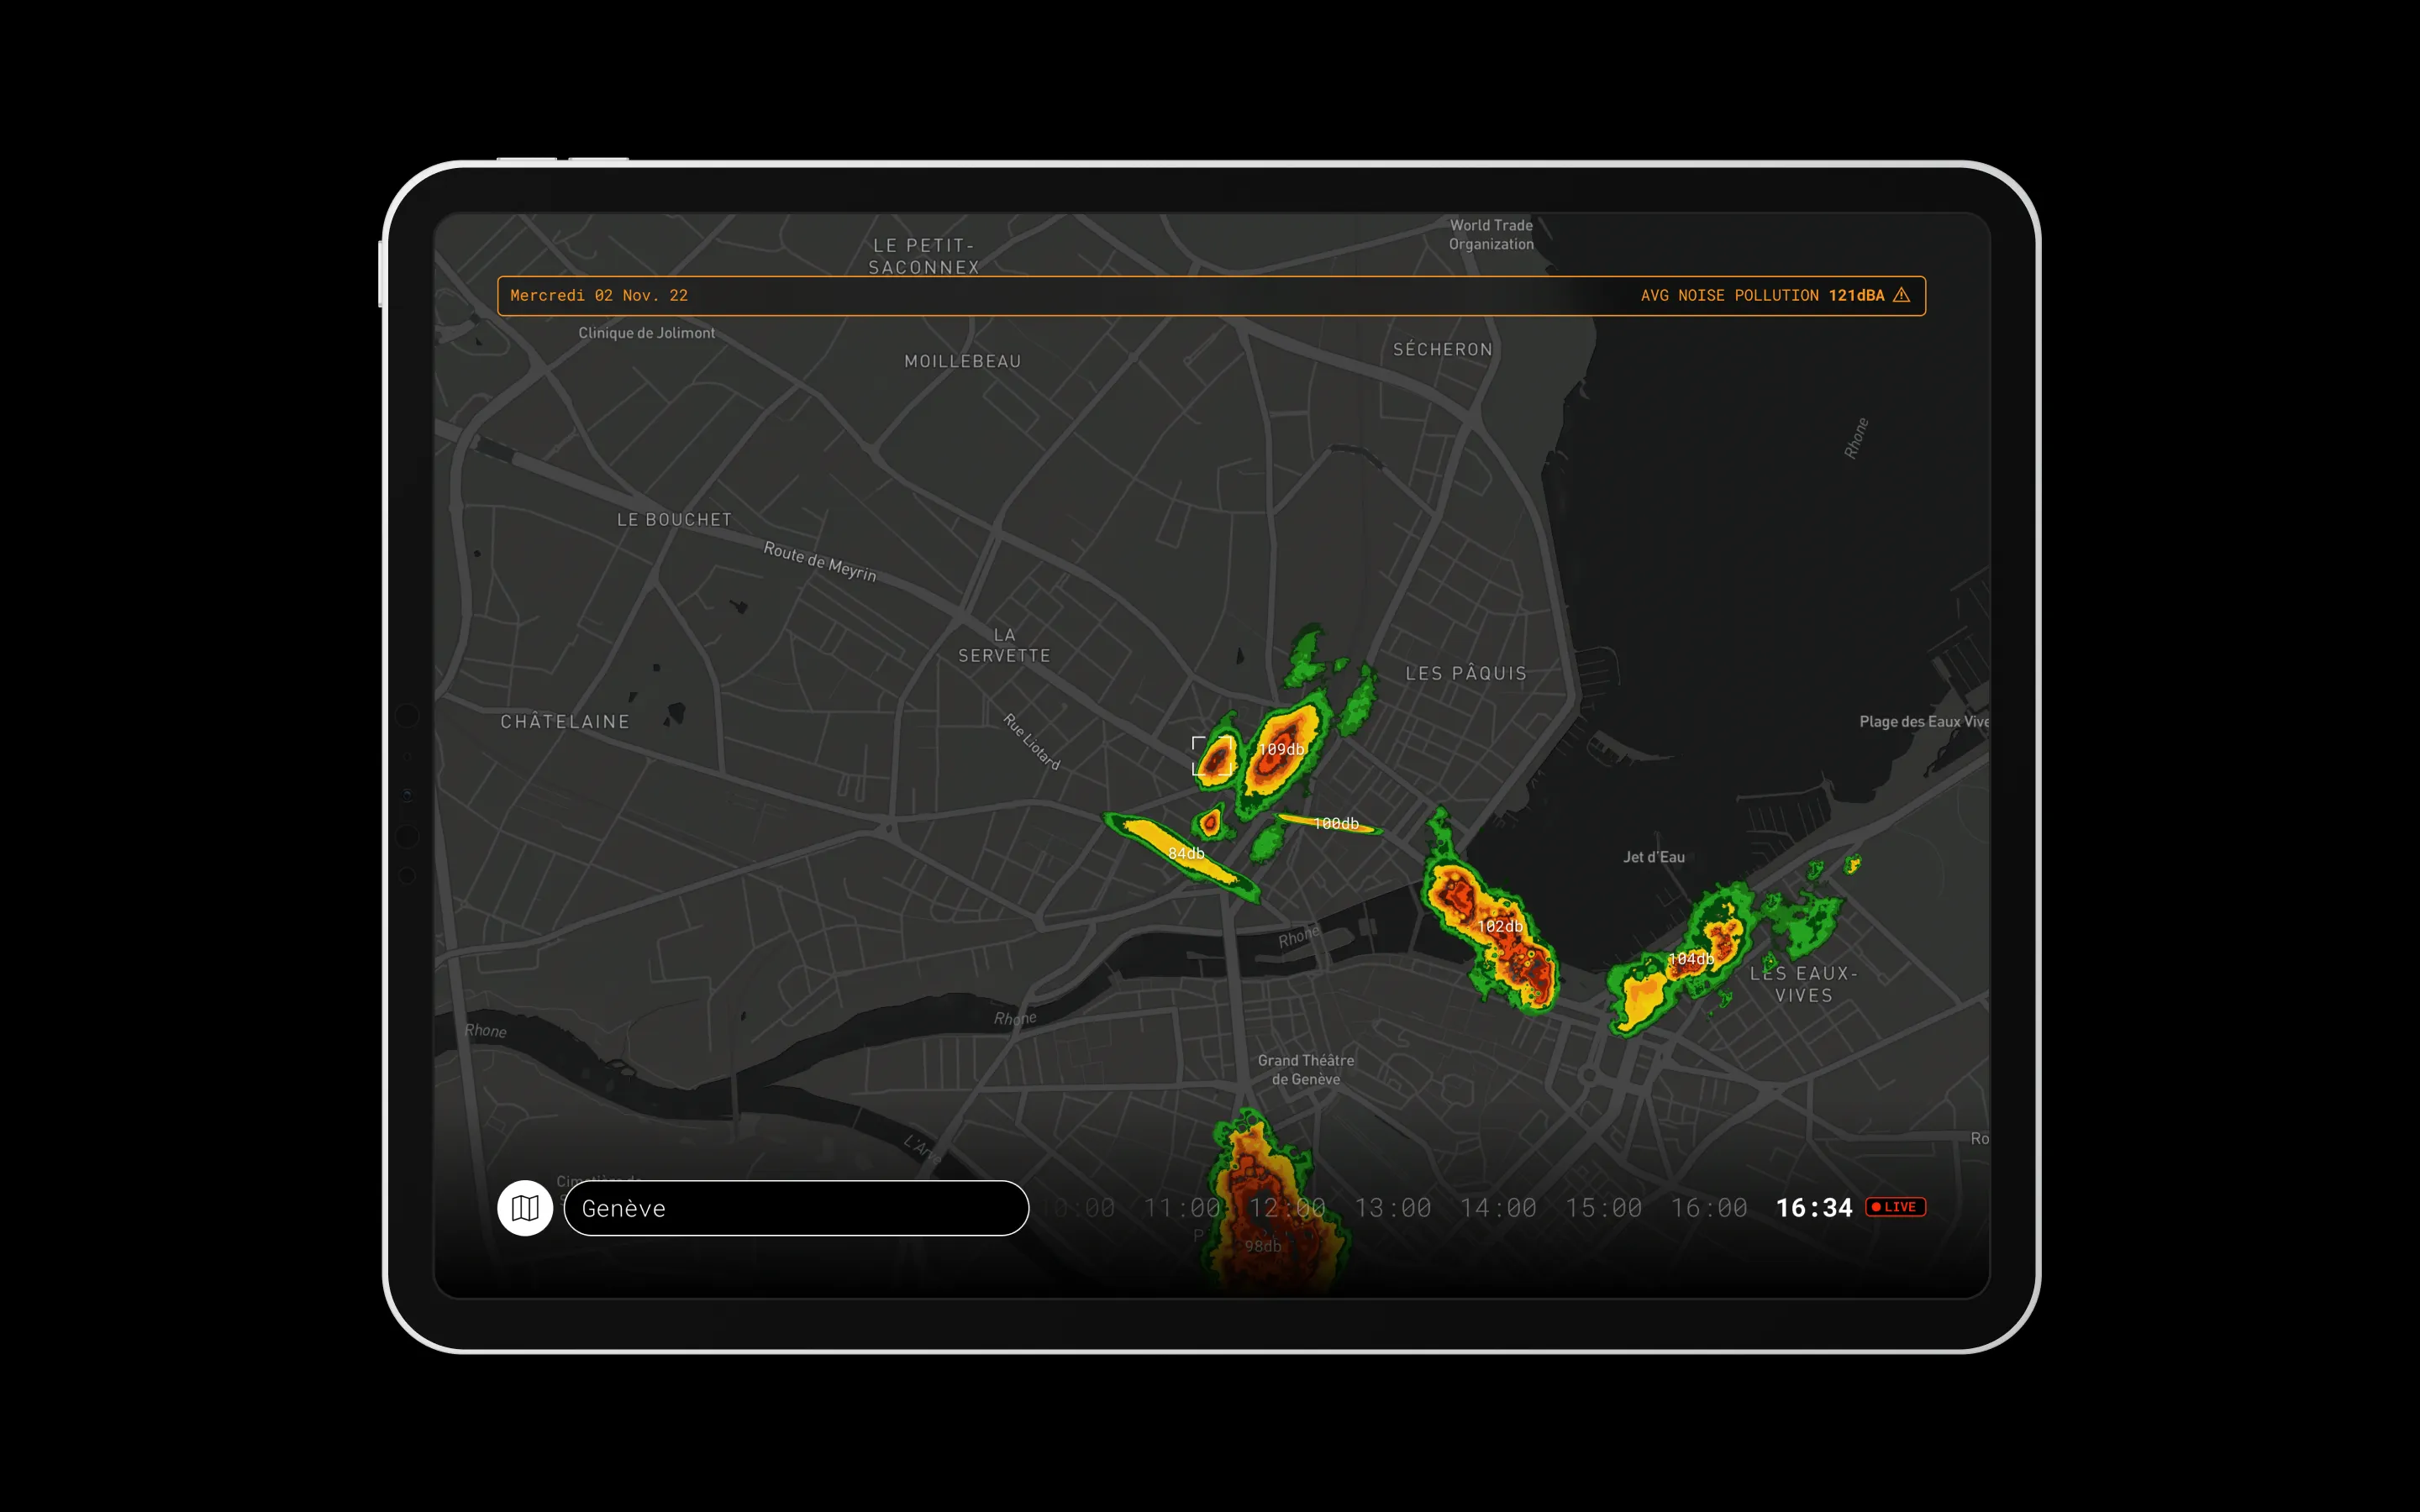
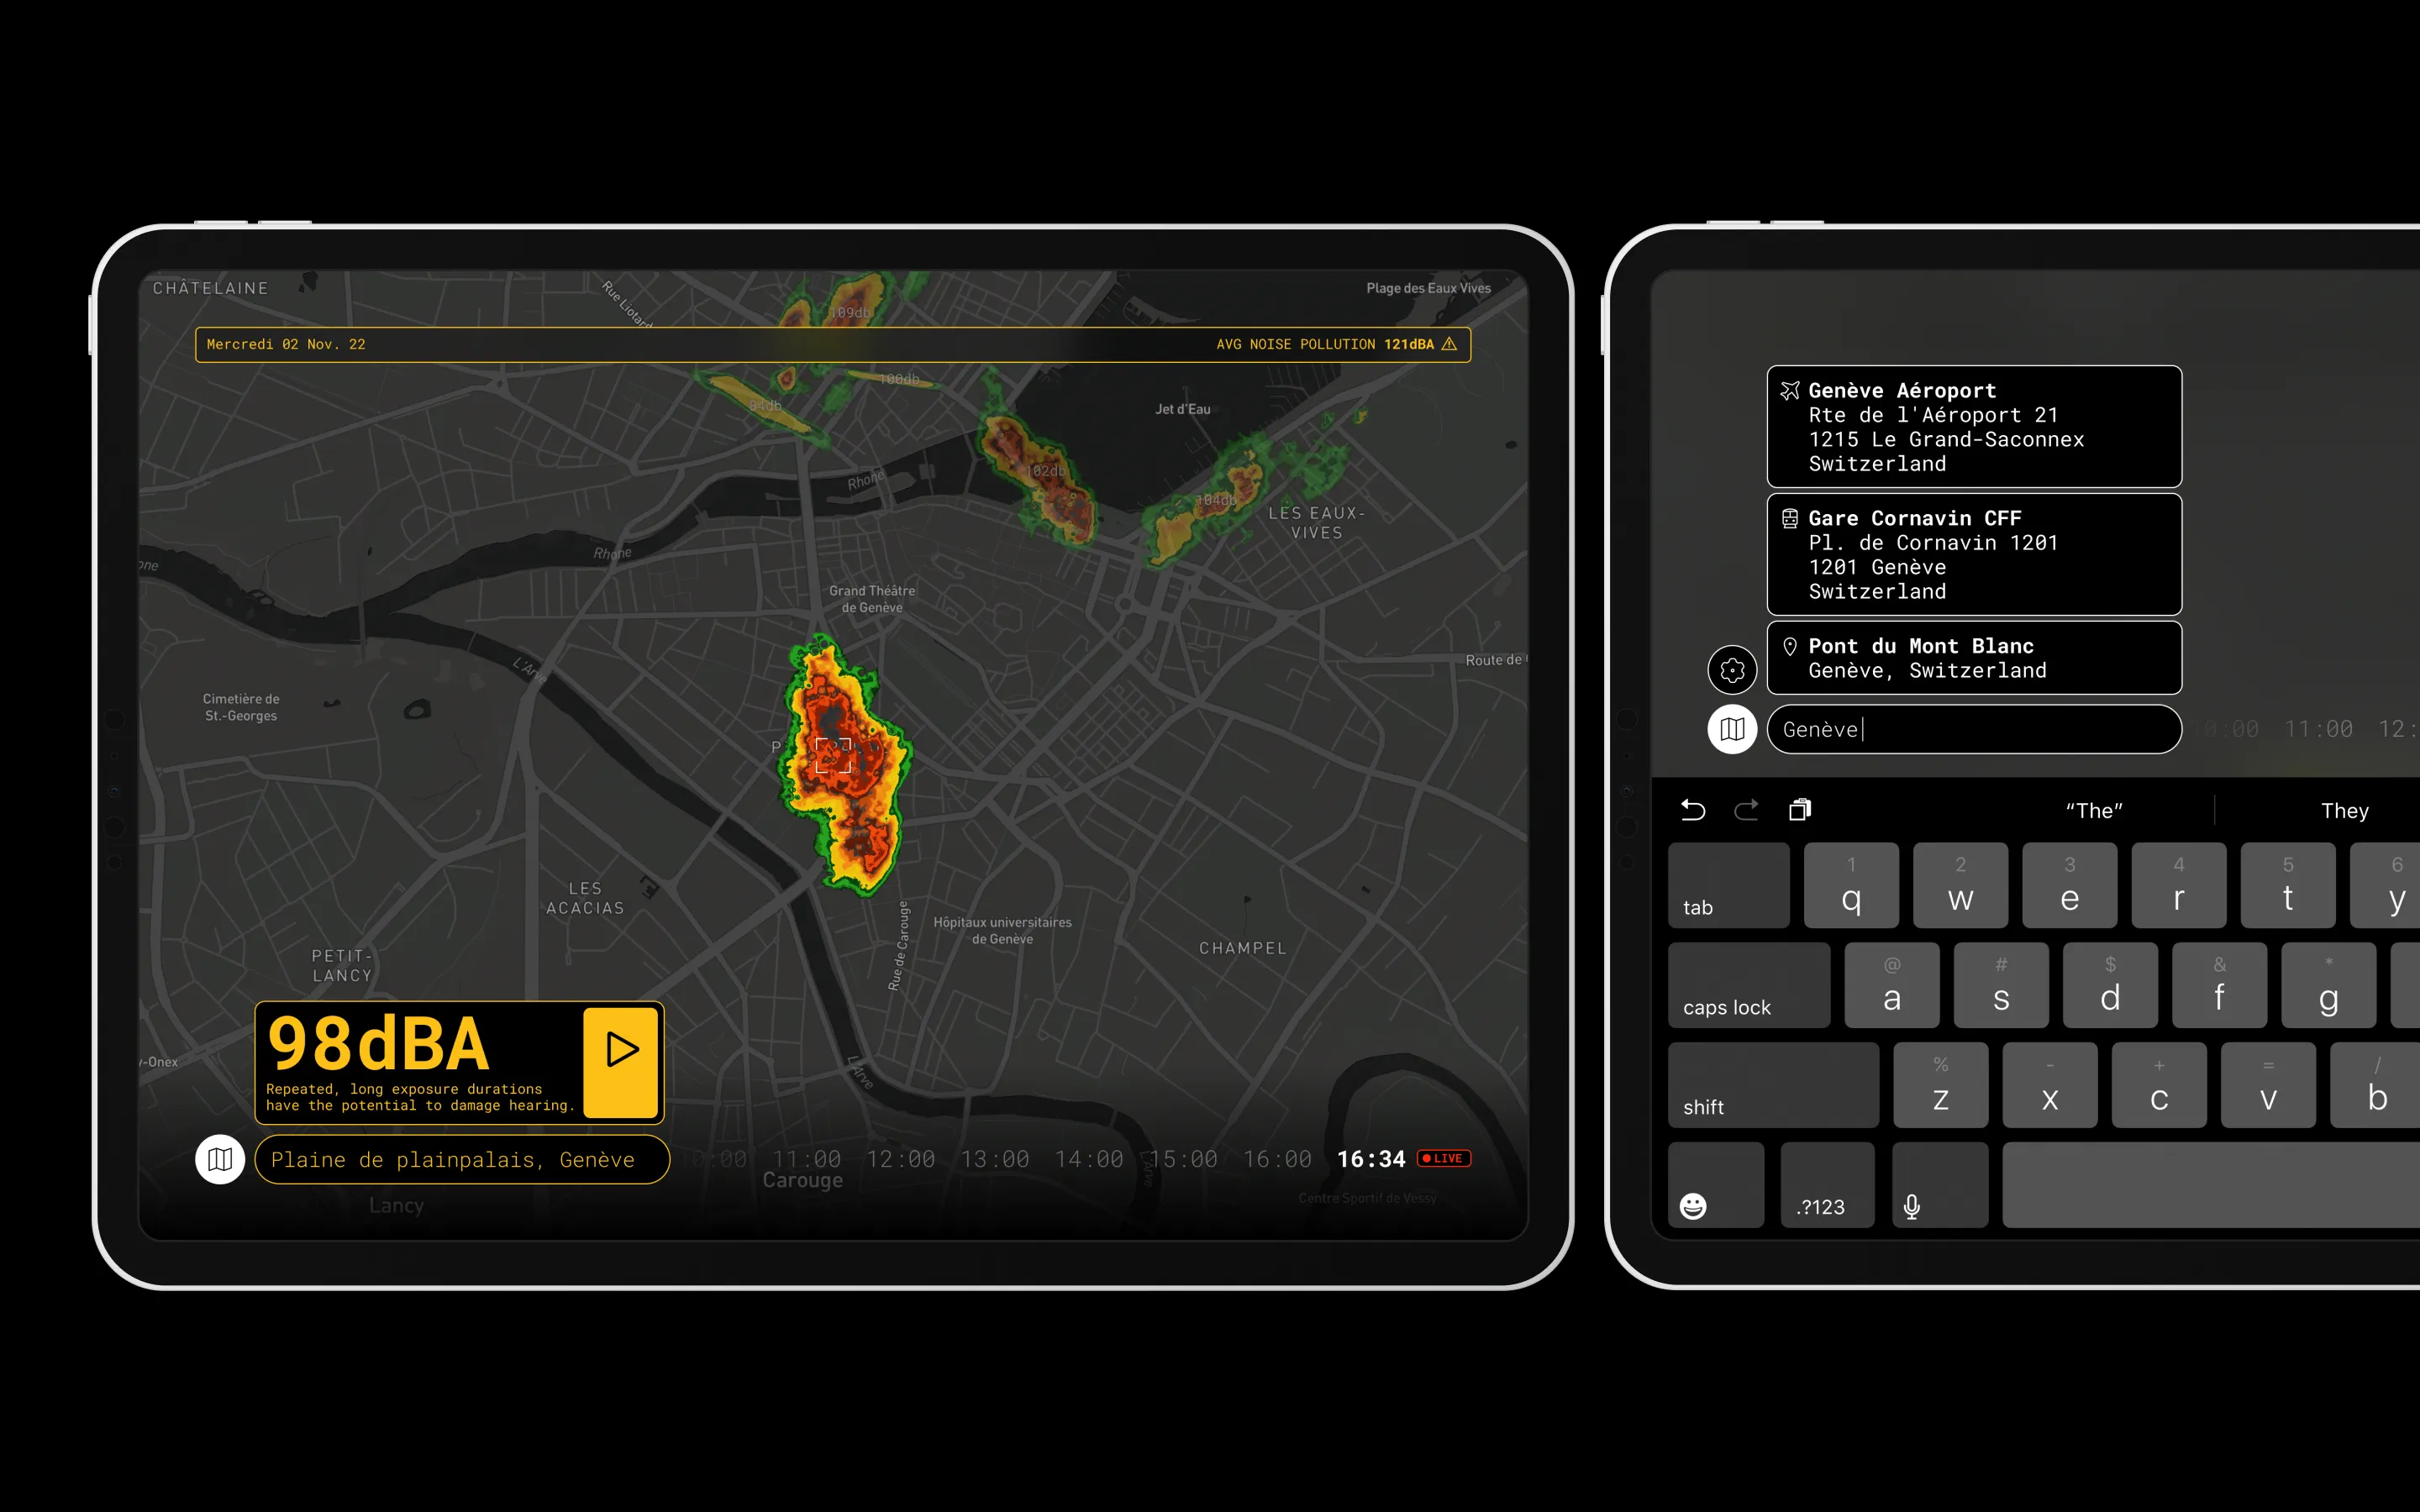
The app features a map with interest points around the city you’re on.
On top, a status bar with the time and date, including the average noise level.
On the bottom, a search bar and a timeline so you can visit the city in its earlier noise levels.
Spot Selection
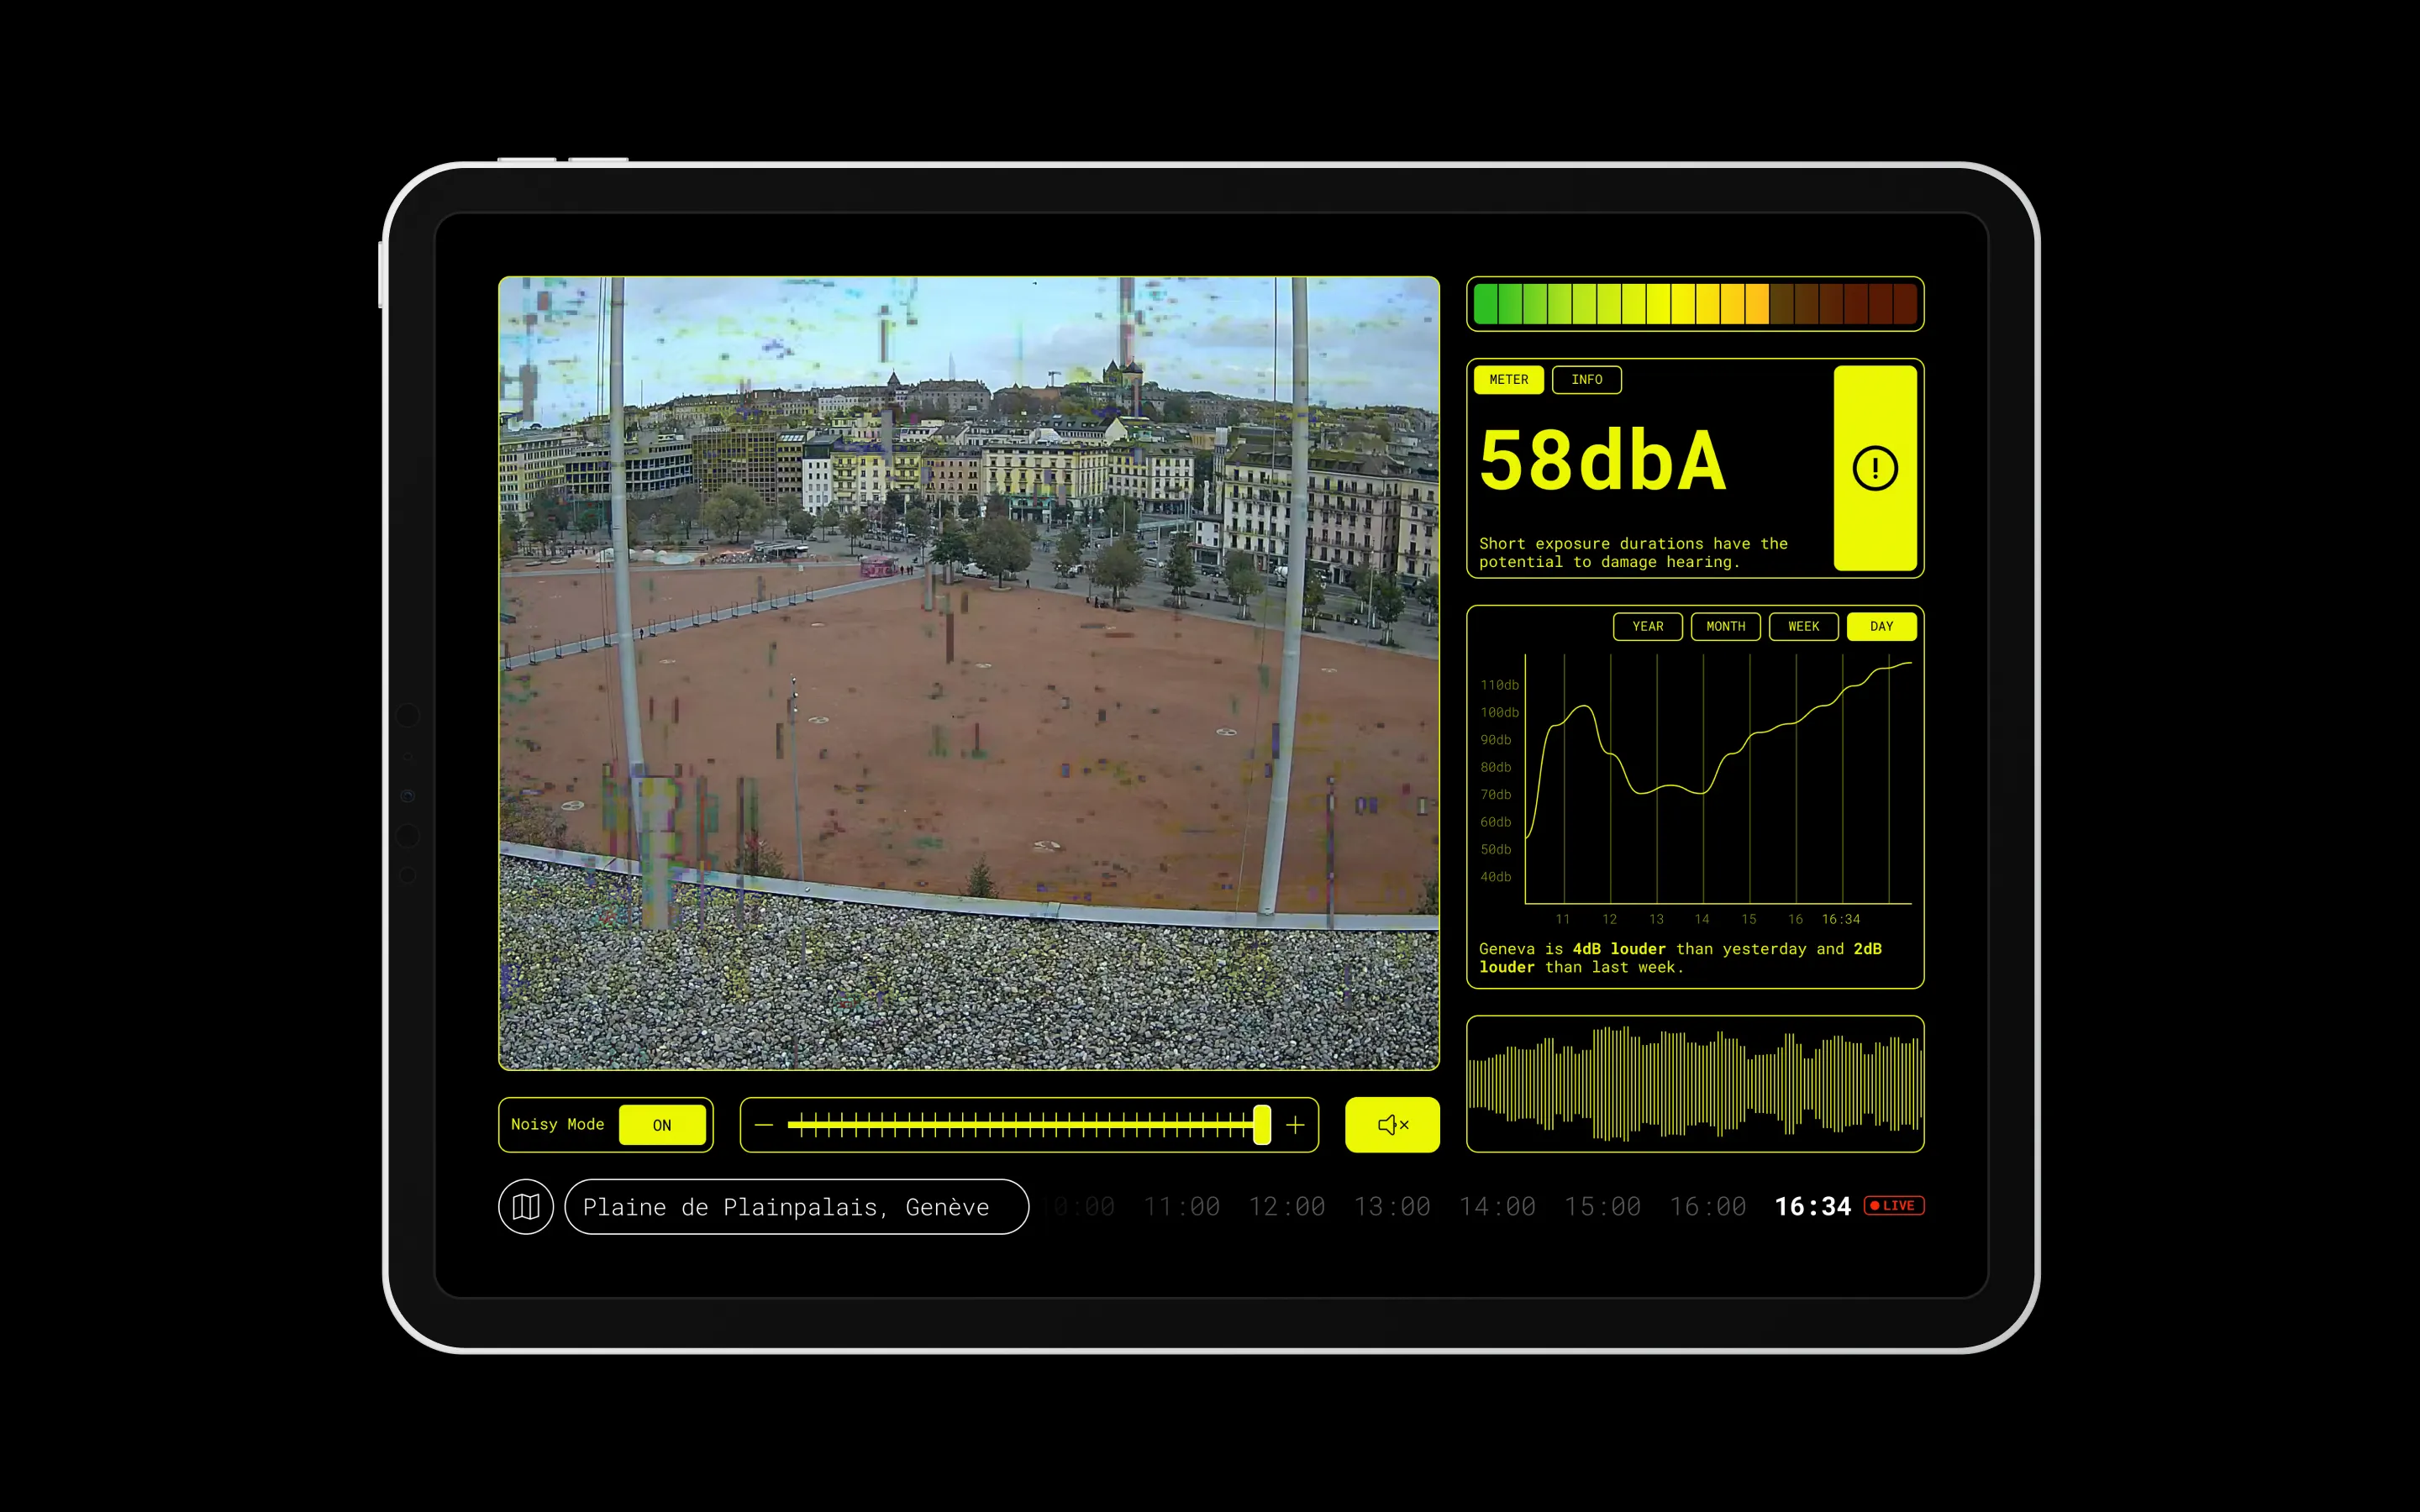
When you select a spot, this page opens with the webcam video feed, a decibel meter, statistics about the place and a sound wave form.
Under the video feed, you’ll find a toggle to enable or disable the video glitch, and a slider to control how much the current noise can affect the video feed.
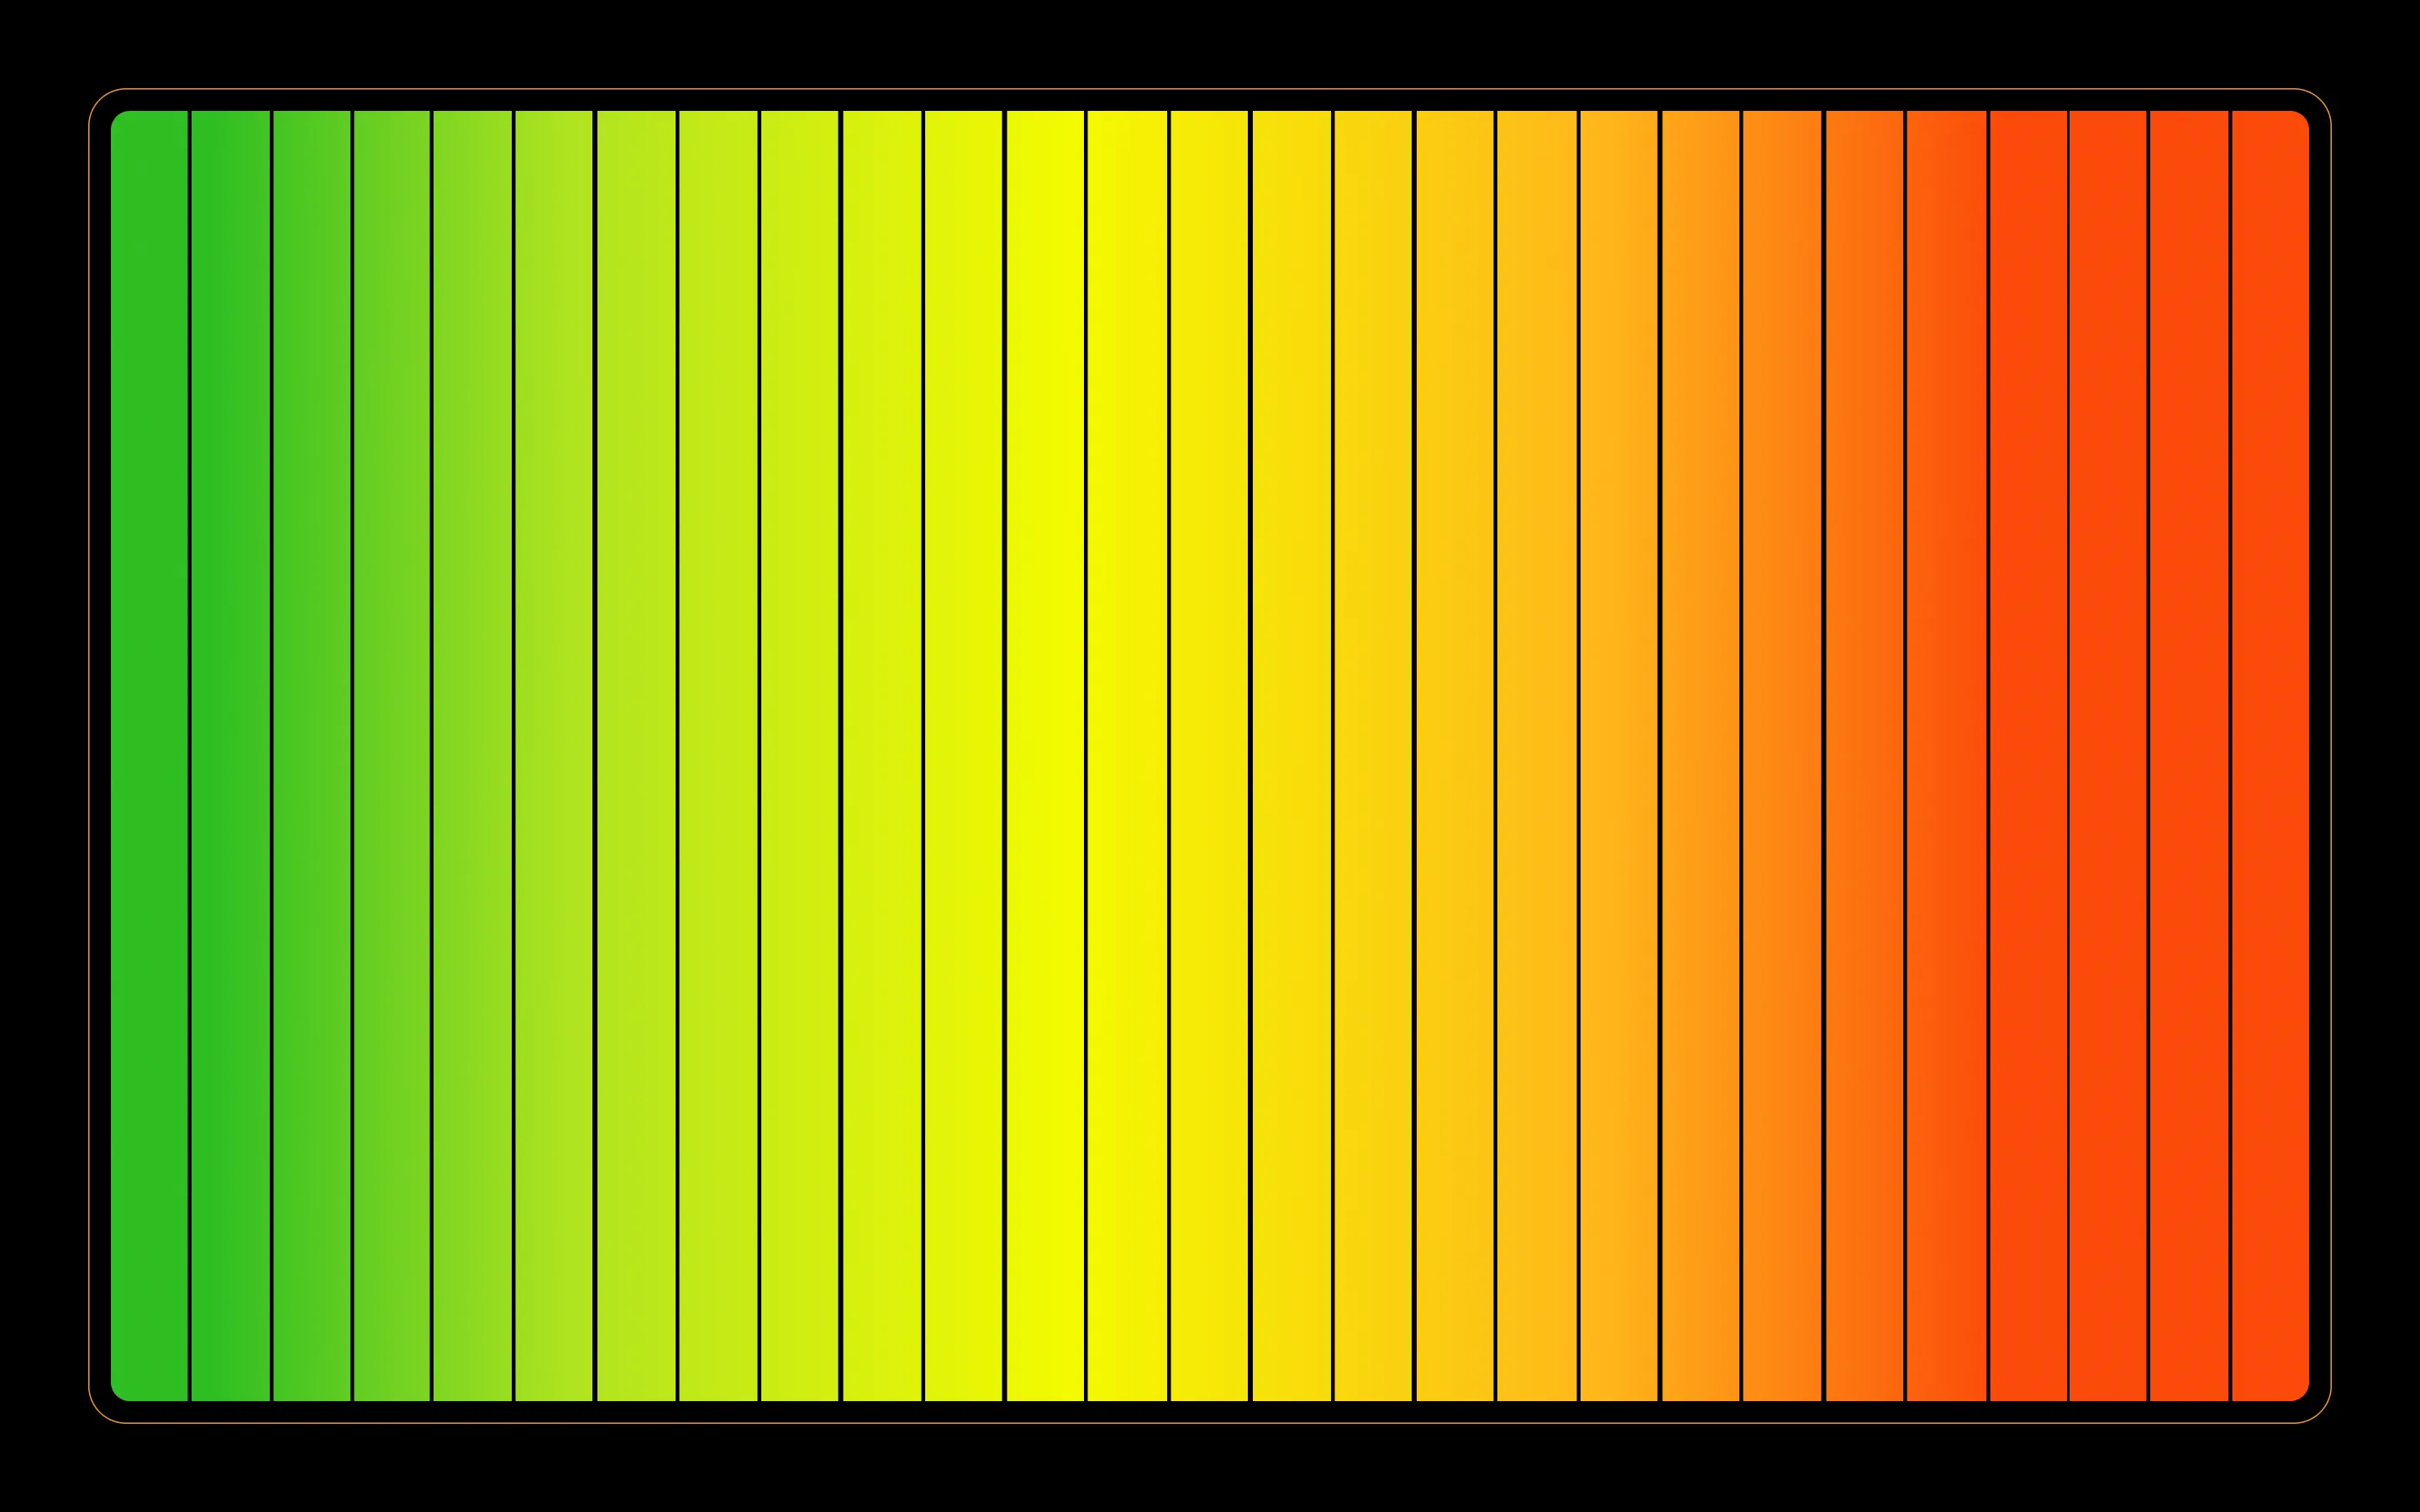
Colors
The color of the whole UI is defined by the city you set as default. So for example, if you open the app by night, the colors might be yellow or maybe green.
Prototype
Please open the prototype on desktop or tablet.